Main Content
Methods
We investigate the interaction of semiconductor materials with light in the near UV, visible and near infrared range. We are particularly interested in photoluminescence, i.e. the light that the materials emit after optical excitation by a laser. We can observe the luminescence both spectrally and temporally as well as spatially resolved. Our aim is to correlate this information with each other. This helps us to develop robust kinetic models that also include the diffusion of optical excitations. On the other hand, we can learn something about the structure-property relationships of inhomogeneous or defective materials on mesoscopic length scales.
Time-resolved photoluminescence spectroscopy
Using time-resolved photoluminescence spectroscopy, we investigate the time scales on which optical transitions occurexcitations recombine with a temporal resolution in the range of one picoseconda few picoseconds. The excitation source for the material samples is a short-pulse laser with pulses of only 100 femtoseconds duration. The time-resolved photoluminescence signal is detected by a streak camera, which allows us to track how the emission spectrum of an excitation population evolves over time.
Spatially resolved spectroscopy
Many of the samples we study are not regularly shaped. Through spatially resolved measurements, we aim to better understand the influence of microstructure on the optical properties. To do this, we use a microscopy setup that allows us to obtain a picture of the local sample structure and to accurately determine the laser excitation spot. We can also use the streak camera to track the spatial evolution of an excitation population as function of time, allowing us to understand the lateral diffusion of excitons and charge carriers.
Low temperature photoluminescence
Temperature can turn off certain non-radiative processes in semiconductor materials, and some defect states exhibit very specific signatures at low temperatures. Moreover, the dynamics of photoluminescence at different temperatures tells us much about the underlying transport mechanisms. To realize such studies, we use a helium flow cryostat, which we cool down to temperatures as low as 4 Kelvin with liquid helium.
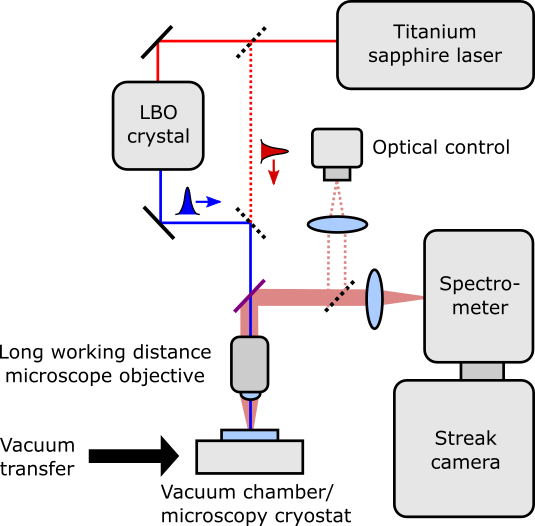
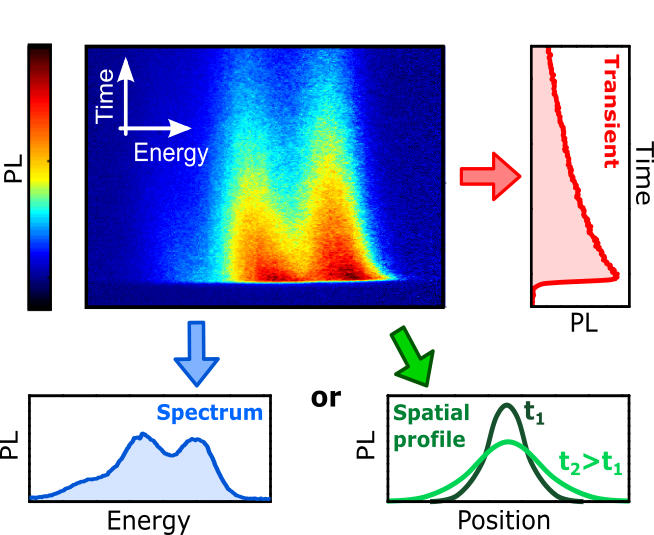
Left: Schematic setup for time-resolved photoluminescence spectroscopy; right: A typical streak camera data set. The false-color plot represents the intensity of photoluminescence as a function of time (vertical axis) and energy (horizontal axis). Alternatively, the spatial evolution of an excitation population can be viewed as a function of time.