Main Content
Native ion-CAIT studies of conductivity
There are two basic versions of ion-CAIT, i. the native ion CAIT and ii. the foreign ion CAIT. The native ion CAIT is the version where the mobile charge carrier in the sample is chemically the same as the one used for attachment.
In fact, the first proof-of-principle experiment in 2011 falls into the class of native ion CAIT. There a potassium ion conducting glass was charged up by attachment of a potassium ion beam. This version is particularly well suited for measuring absolute conductivities and activation energies for ion hopping. There are numerous examples, where we have compared the CAIT conductivities to those derived from impedance the spectroscopy. There was always and in each case a quantitative agreement.
Fig. 1 shows the Arrhenius plot for K+ conductivity in KBSi2O6. The absolute conductivities and the activation energy agree with numbers from impedance spectroscopy.
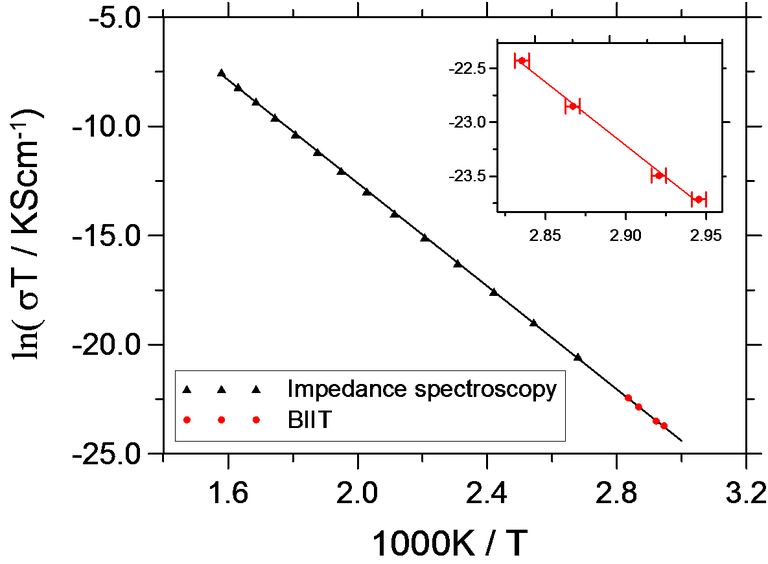
Fig. 1 Arrhenius plot for the conductivity of KBSi2O6 [1].
As a second example we discuss the ionic conductivity and the activation energy for a series of alkali calcium phosphate glasses with composition xCaO·(55-x)M2O·45P2O5 (M = Na, K, Rb, Cs; x = 20, 30, 40). Some typical conductivity data are shown in Figure 2.
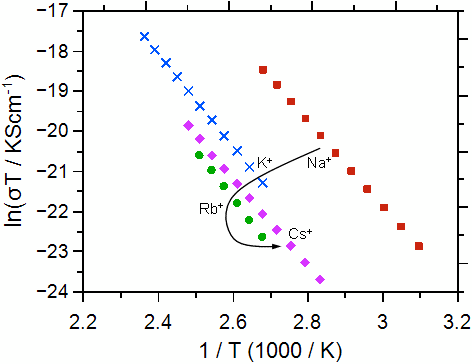
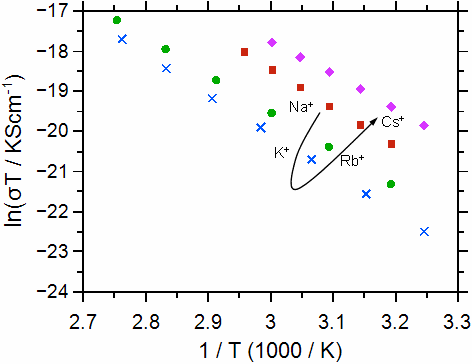
Fig. 2 Arrhenius plot for the calcium-phosphate glasses investigated: molar fraction of Ca++ 30% (left graph), molar fraction of Ca++ 20% (right graph). The alkali ions are indicated. The graphs have been taken from Martin et al. [2]. Error bars are smaller than symbols.
Ultimately, the conductivities and activation energies can be discussed in relation to the radius of the Ca++. Both the Ca++ and the M+ bind to the non-bridging oxygens in the poly-phosphate tetrahedrons, however the binding should be much stronger for the Ca++. The data show that the conductivity overall increases as the radius of the alkali ion M+ approaches that of the Ca++ ion. The difference between the conductivities and also the activation energies for the different calcium contents becomes smaller as the radius of the alkali ion approaches that of the Ca++ ion.
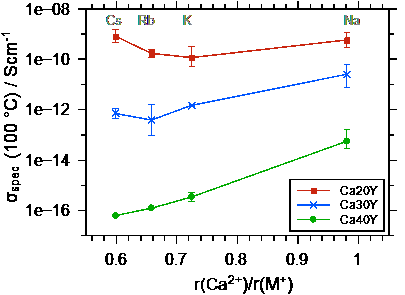
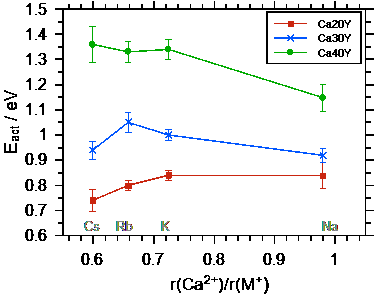
Fig. 3 Left graph: conductivity at 100 °C as a function of the ionic radius ratio r(Ca++) / r(M+). Right graph: activation energy for DC ion transport as a function of the ratio of the radii of Ca++ and M+. Taken from Martin et al.[2].
Literature
[1] P.V. Menezes, J. Martin, M. Schäfer, H. Staesche, B. Roling and K.-M. Weitzel
Bombardment induced ion transport – Part II Experimental potassium ion conductivities in borosilicate glass
PCCP, 13, 20123-20128 (2011)
http://dx.doi.org/10.1039/c1cp21216h
[2] J. Martin, M. Schäfer, K.-M. Weitzel
Effect of structure and composition on the DC-conductivity in calcium phosphate glasses of the type x CaO ∙ (55-x) M2O ∙ 45 P2O5 (M:Na, K, Rb, Cs)
Journal of Non-crystalline solids, 430, 73–78, (2015),
http://dx.doi.org/10.1016/j.jnoncrysol.2015.10.004