Main Content
Figure 7
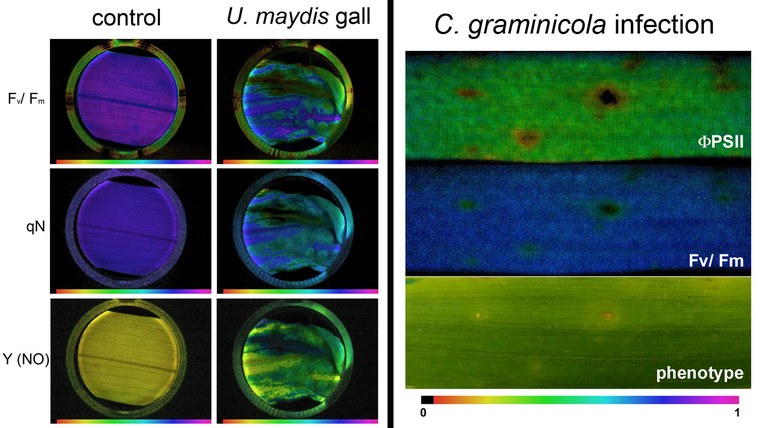
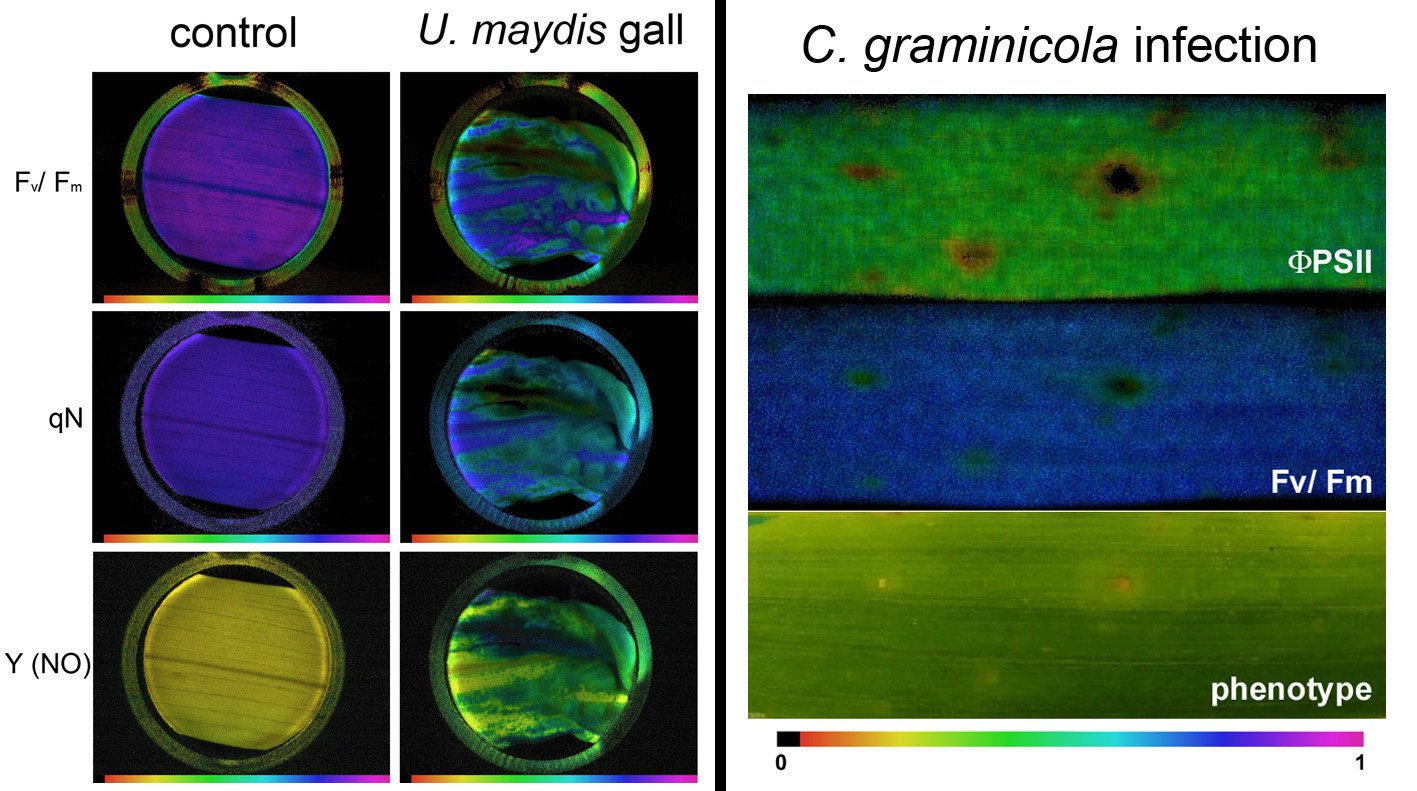
left: Chlorophyll fluorescence imaging analysis of maize leaves infected with the biotrophic fungus U. maydis (right) and mock control leaves (left). The maximum photosystem II quantum yield Fv/Fm (top), non-photochemical quenching. i.e. regulated energy dissipation, qN (middle) and non-regulated energy dissipation Y(NO) (bottom) are shown in false color images with the scale ranging from 0 (black) to 1 (purple), as indicated by the color bar at the bottom.
right: Chlorophyll imaging of a maize leaf infected with the fungal hemibiotroph C. graminicola. The photosystem II quantum efficiency (FPSII - top) and the maximum photosystem II quantum yield Fv/Fm (middle) are shown in false color images with the scale ranging from 0 (black) to 1 (purple), as indicated by the color bar at the bottom. For comparison, a photograph of the same leaf is displayed in the bottom panel
(click to enlarge figure)