Main Content
Bulk random packings of hard (solid, impermeable) particles with different packing density (porosity), packing microstructure (degree of heterogeneity), and particle size distribution
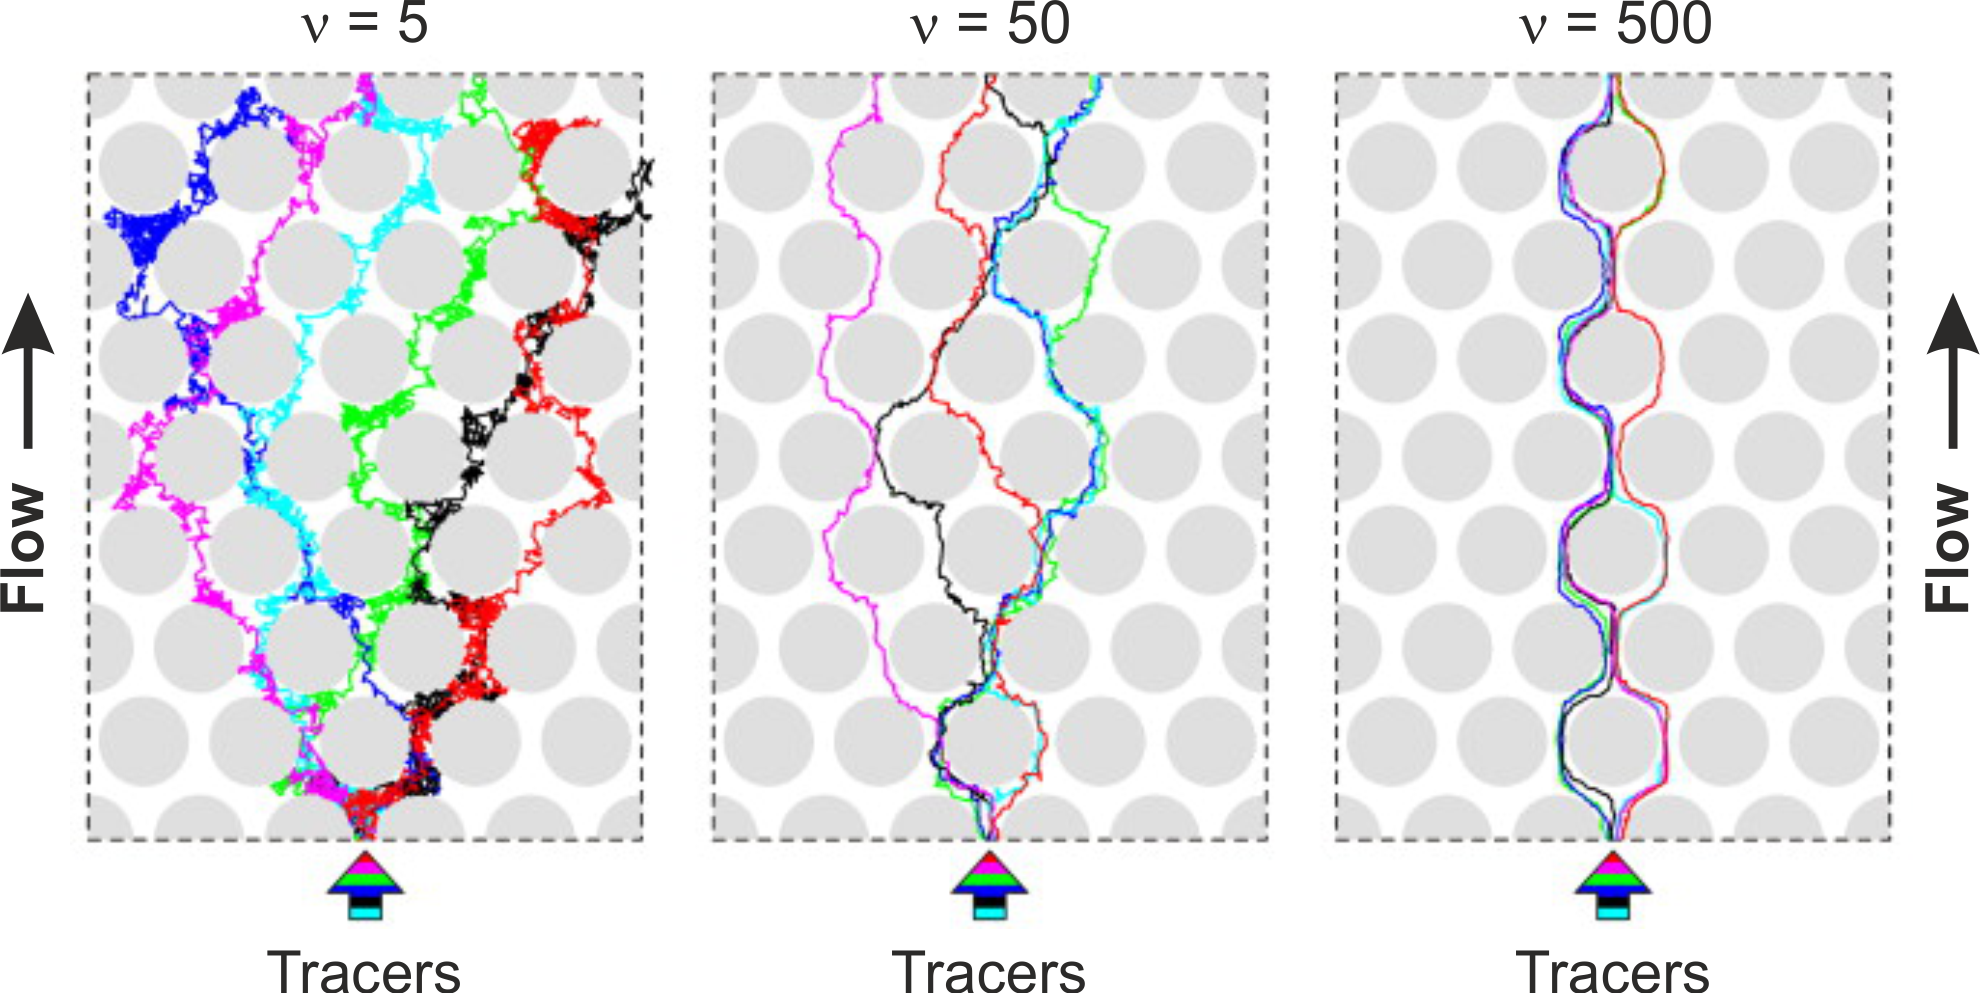
Tracer trajectories simulated with a random-walk particle-tracking method in a two-dimensional hexagonal pillar array (solid volume fraction: 0.6) at reduced velocities of 5, 50, and 500 (the reduced velocity is given by uavdp/Dm, where uav is the average flow velocity, dp the pillar diameter, and Dm the diffusion coefficient in the bulk fluid). These results illustrate the velocity-dependent, effective interplay between longitudinal advection and transverse diffusion. Six color-coded tracers were released at the same location (as indicated by the striped arrow) and their pathways within the predefined section (fixed spatial window) monitored.
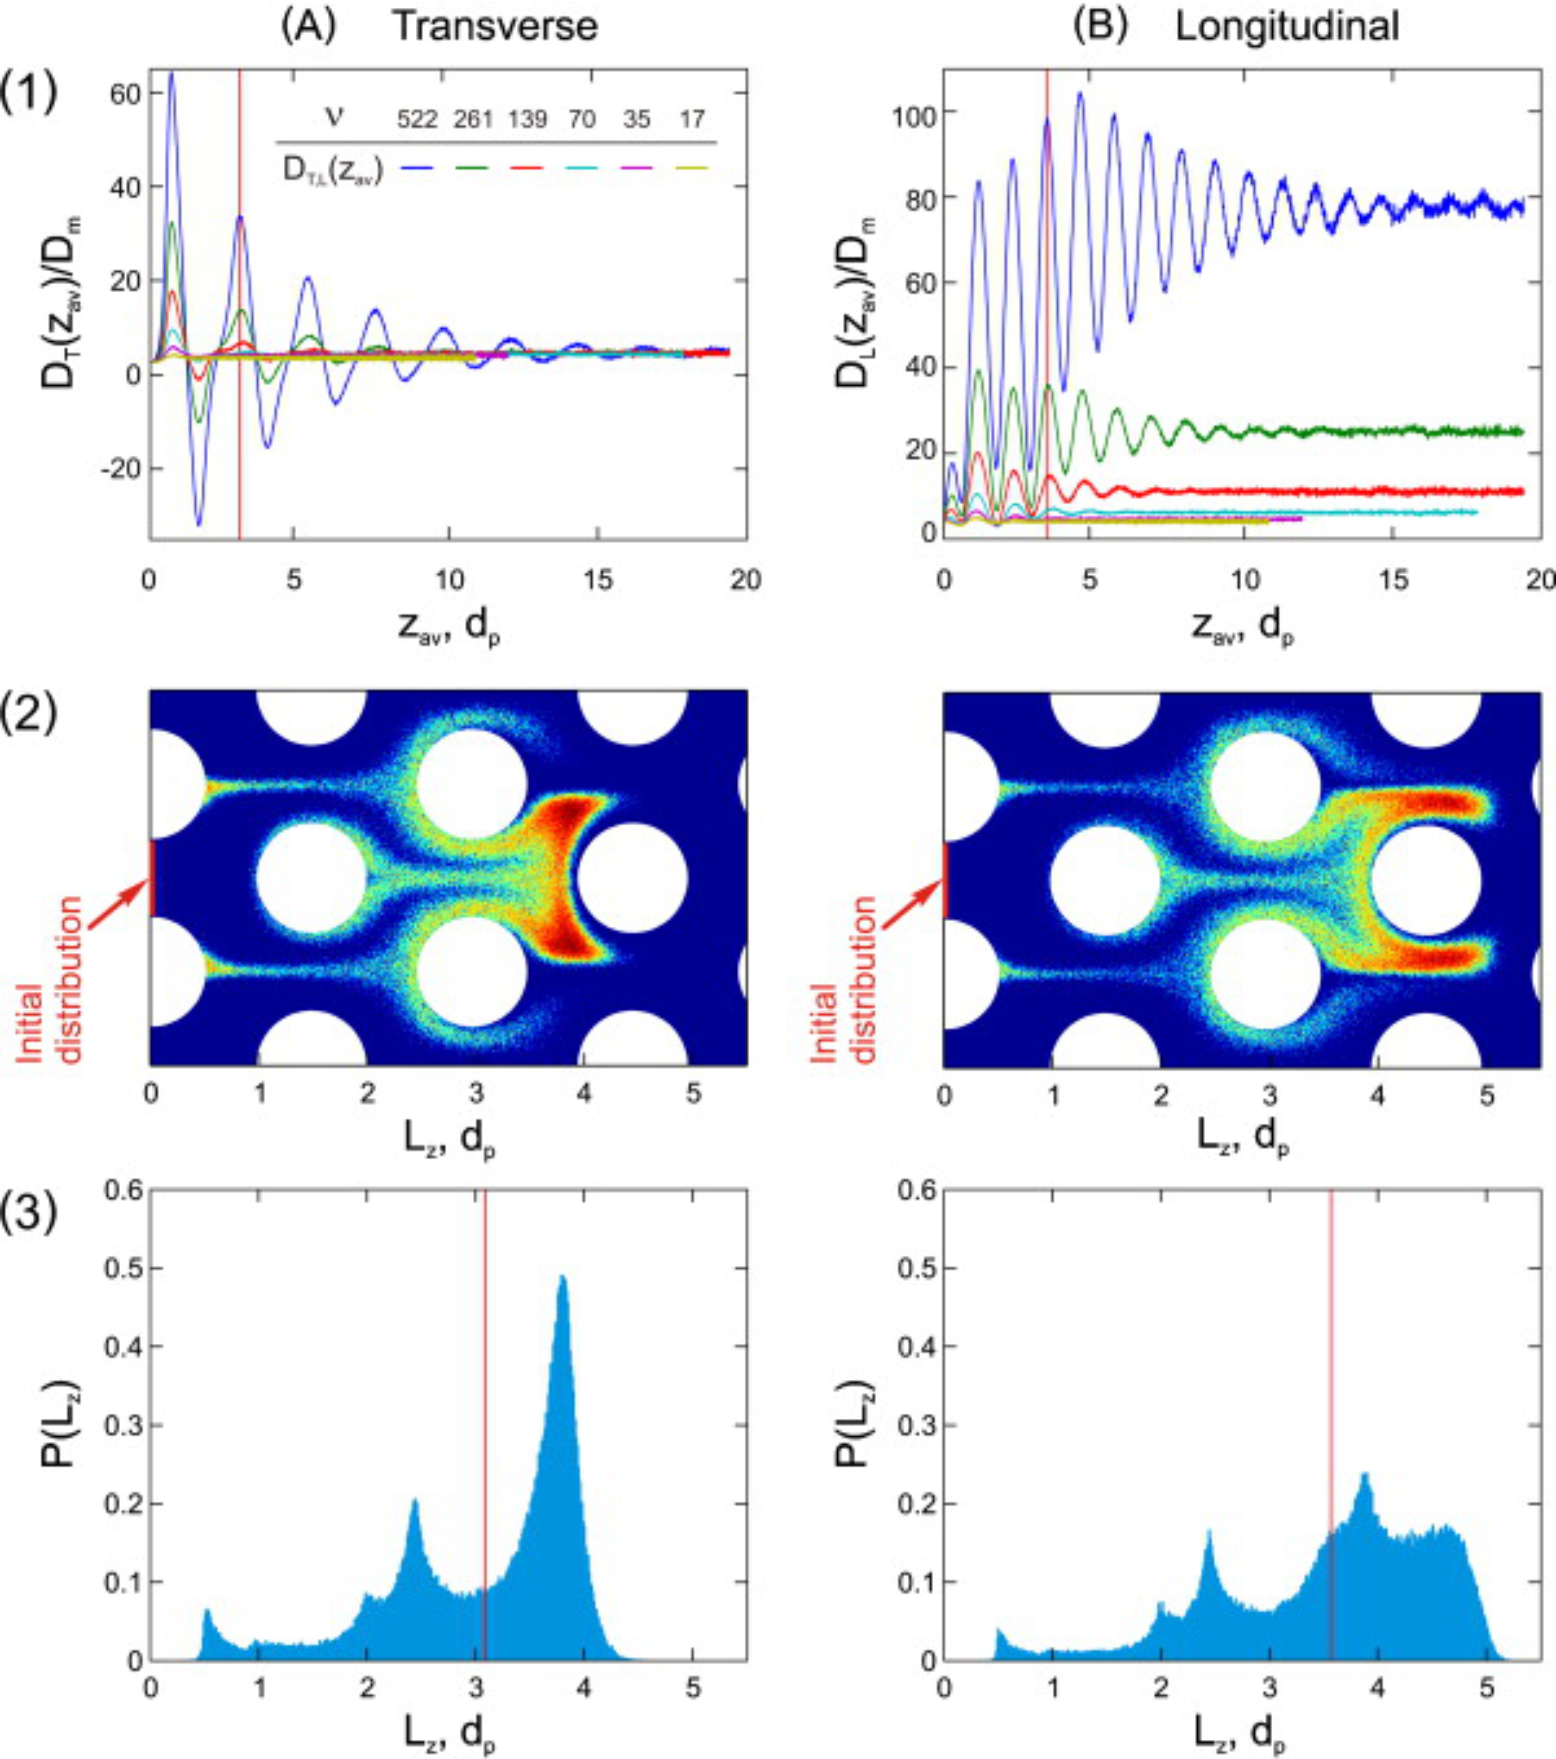
Analysis of transient transverse (A) and longitudinal (B) dispersion in a bulk pillar array (porosity: 0.7) at selected values of the reduced flow velocity. Transverse and longitudinal dispersion coefficients (panel 1) are plotted as a function of the position of the center of gravity of the tracer ensemble, zav. The 2 × 10⁵ tracers were initially (t = 0) distributed uniformly in a plane between two pillars, as indicated in panel 2 by the thick red lines ("initial distribution"), which simulates local pulse injection. The tracer zone then moves downstream with the flow (from left to right), which is monitored by the travelled longitudinal distance of the tracers, Lz (in dp). Two-dimensional concentration snapshots and associated one-dimensional distribution profiles in panel 2 and panel 3 correspond to zav = 3.1dp and zav = 3.6dp (indicated by the red vertical lines in panel 3). These values of zav reflect local maxima of the transient dispersion curves in panel 1 (also marked by red vertical lines). The data shown in panel 2 and panel 3 were obtained for a reduced velocity of 522 (cf. blue curves in panel 1). The movies, which visualize the transverse and longitudinal dispersion dynamics in more detail, were obtained for this reduced velocity of 522 ( clickable link to movie) as well as for a reduced velocity of 139 ( clickable link to movie).
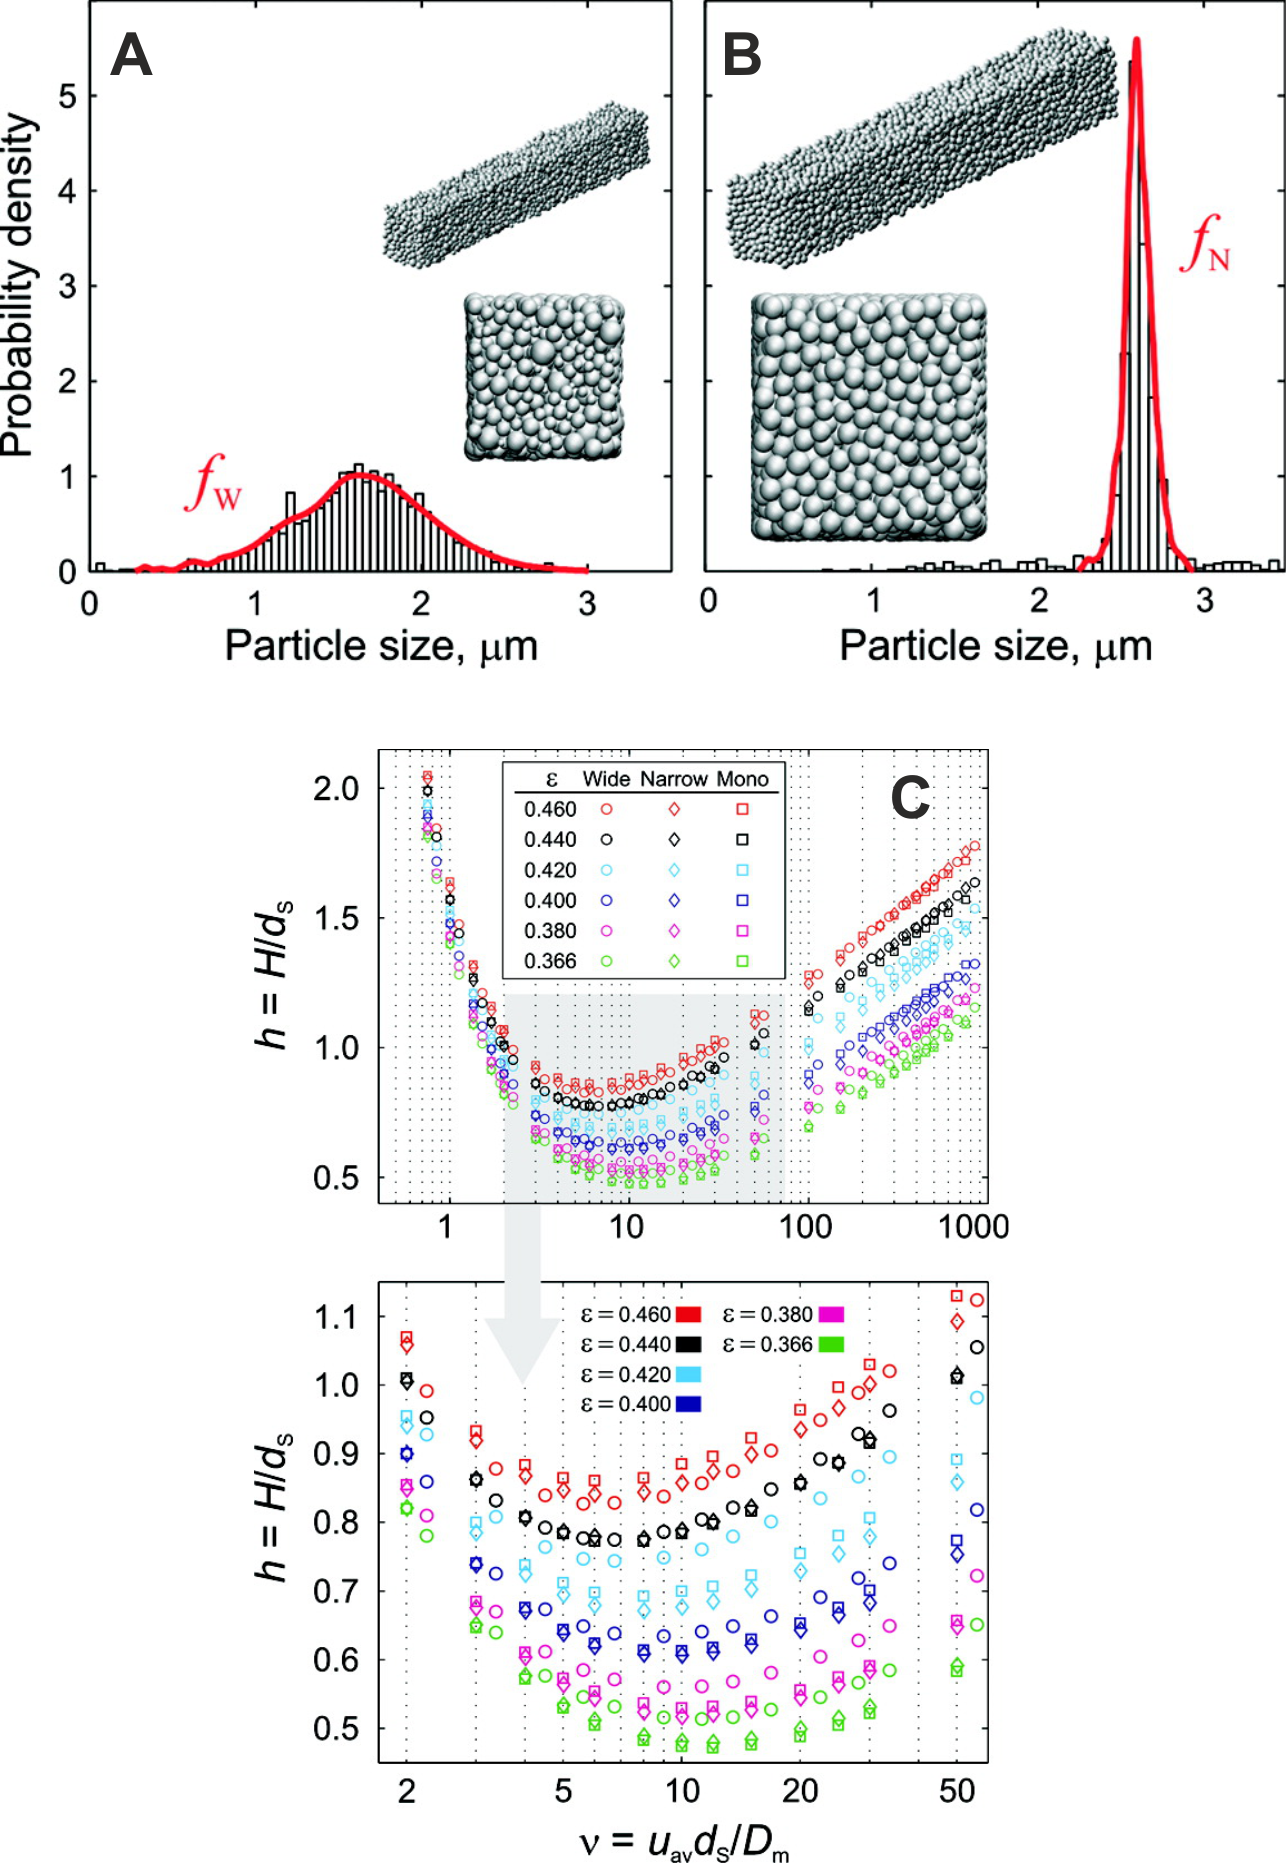
Particle size distributions (PSDs) of (A) sub-2 μm fully porous particles (wide PSD) and (B) sub-3 μm core–shell particles (narrow PSD), experimentally determined by scanning electron microscopy. Histograms were converted into probability density functions fW and fN (red curves) for the computer-generation of polydisperse random sphere packings. Selected wide-PSD and narrow-PSD packings of ca. 10dA x 10dA x 70dA (where dA is the number-mean diameter) at a bed porosity of 0.366 are shown as insets. Panel C compares reduced plate height curves simulated with the LBM–RWPT approach for wide-PSD (circles), narrow-PSD (diamonds), and monodisperse (squares) packings at bed porosities of 0.366–0.46 (different porosities are color-coded). Plate heights and velocities are normalized by the surface-mean diameter dS (and Dm = 1.56 x 10⁻⁹ m2/s). The zoomed region (gray-shaded) compares the plate height data for reduced flow velocities from 2 up to 60.