Main Content
Reconstructed HPLC-microchip packings
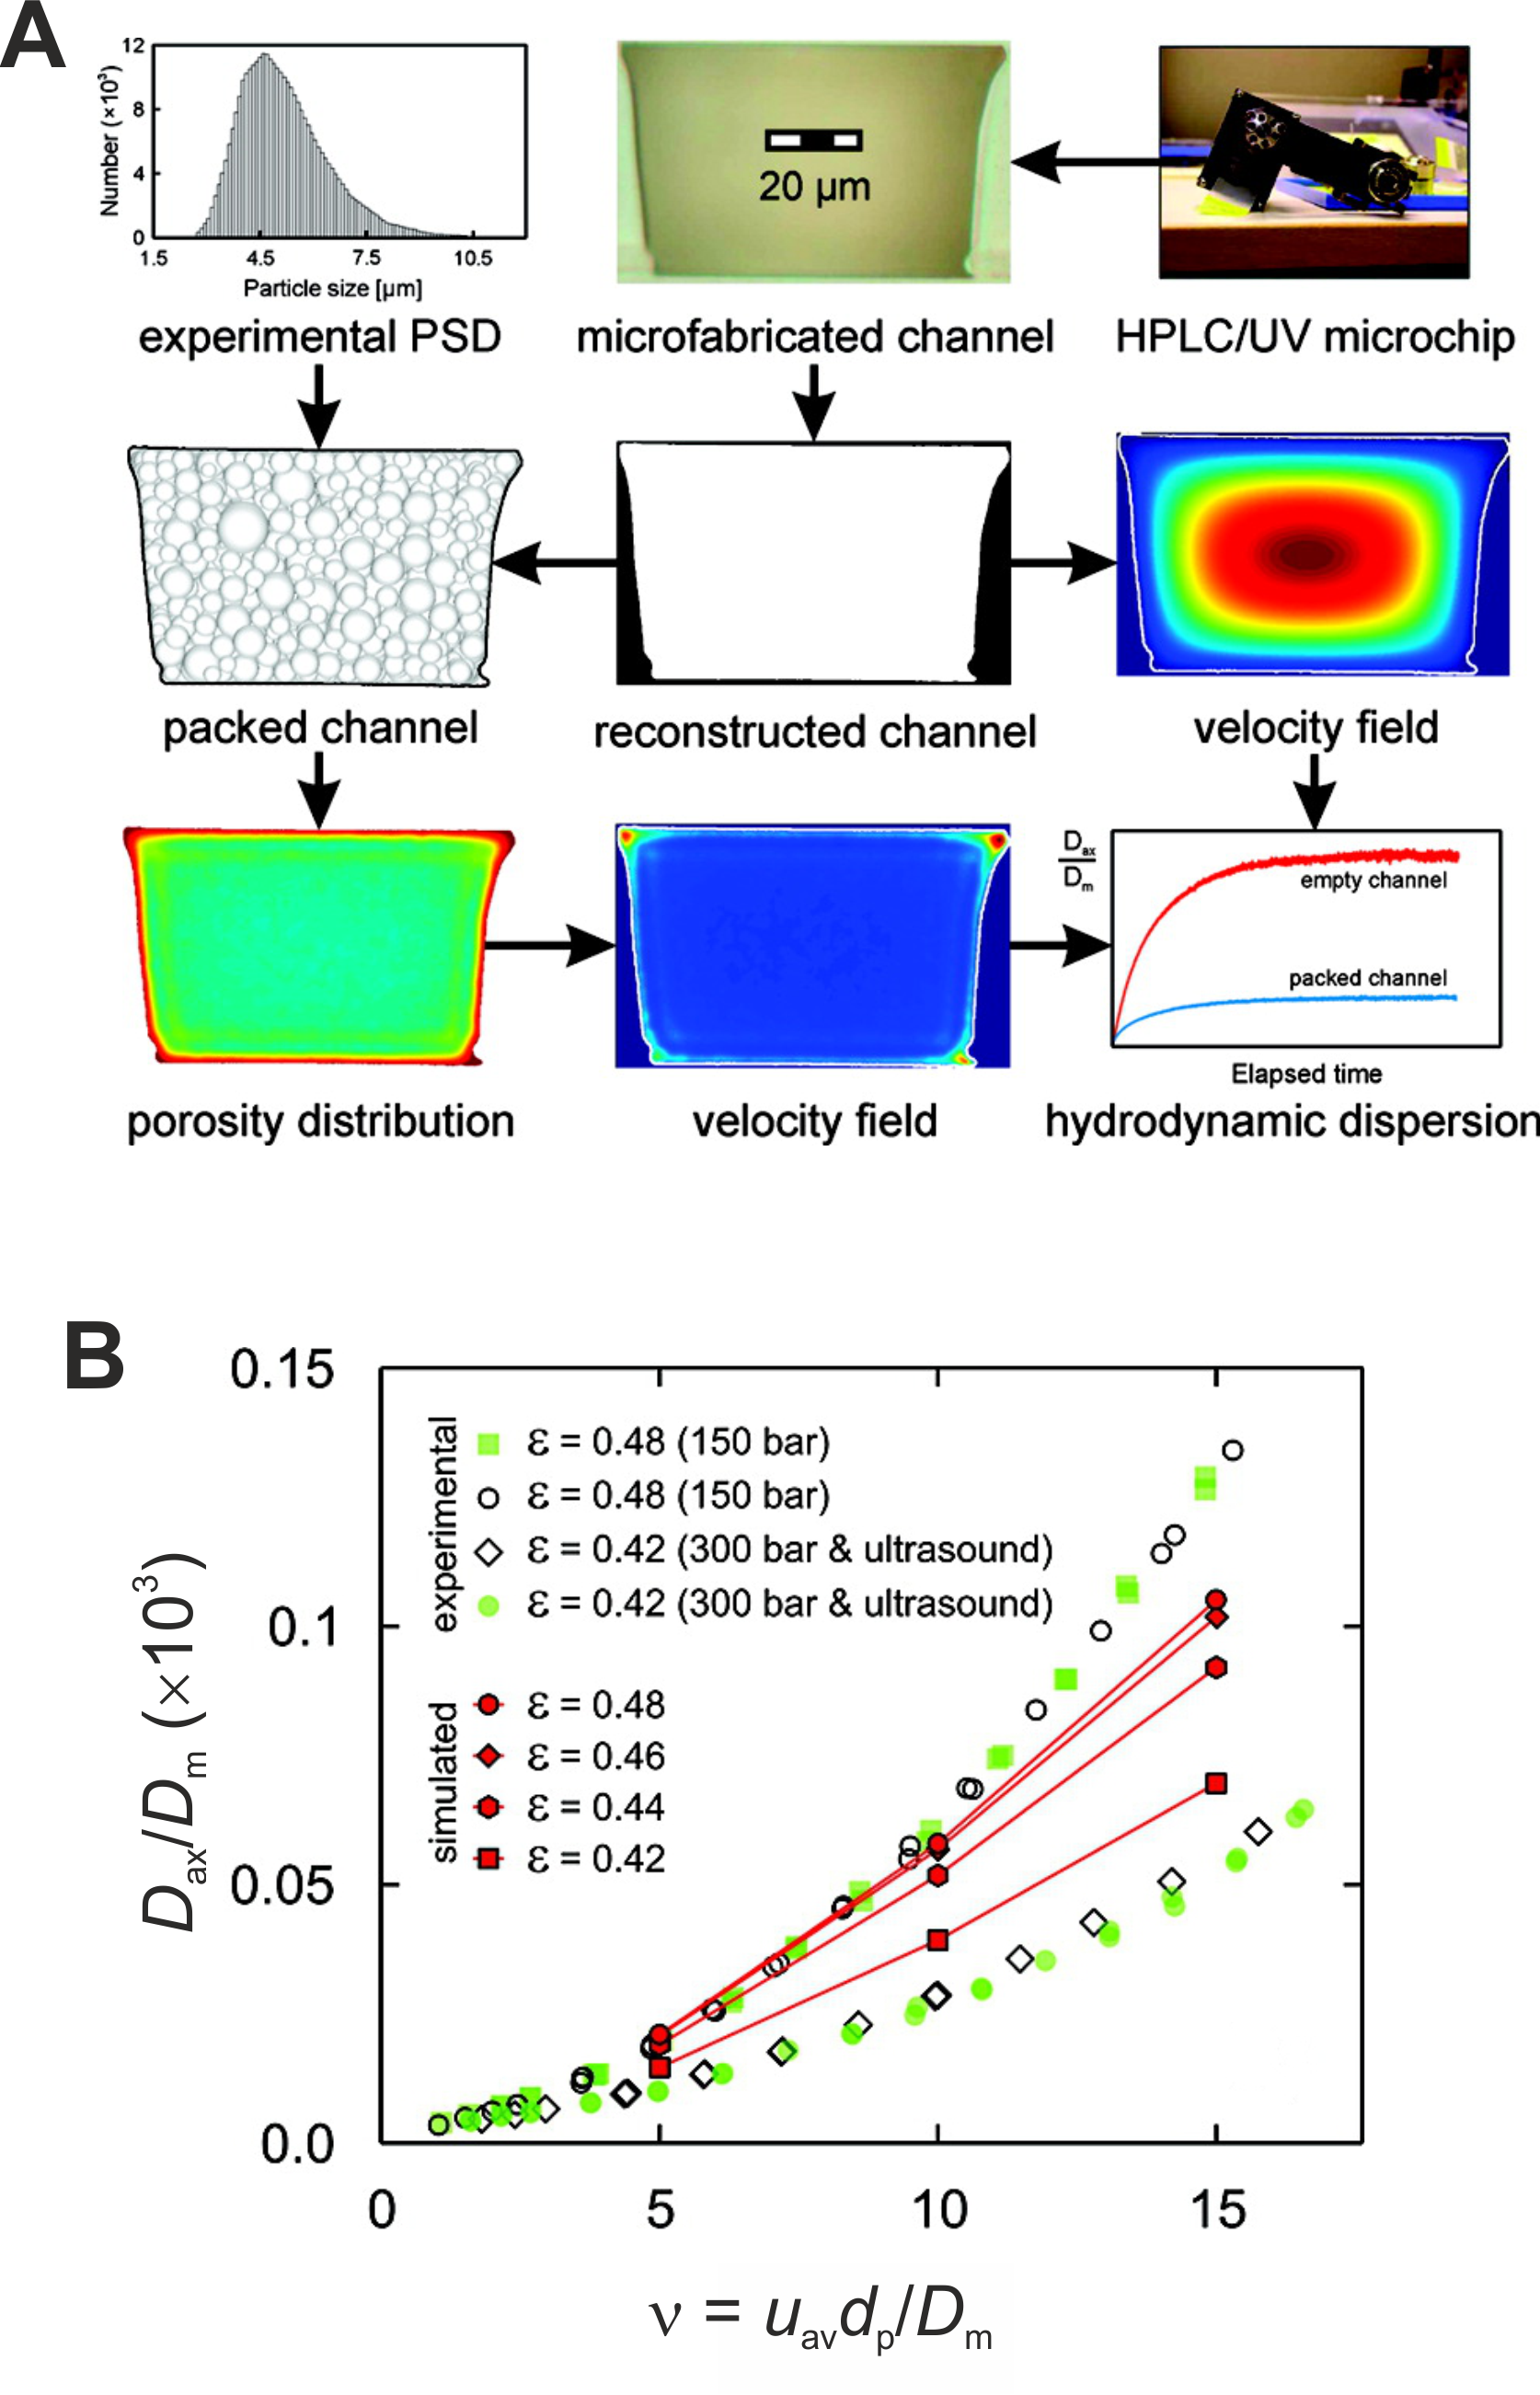
Panel A. Schematic representation of the basic elements and flow of information in the study of mass transport in a particle-packed microchip separation channel. Top row (from right to left): prototype HPLC/UV-microchip placed between the stator and rotor of a Rheodyne valve (left) and a special holder (right) for connection to a diode array UV-detector; high-resolution image of the unpacked separation channel on this microchip; number-based particle-size distribution of the packing material. Central row: reconstructed cross section of the microchannel (middle); lateral velocity distribution calculated with a lattice-Boltzmann method in the empty reconstructed microchannel (right); cross section of a reconstructed microchip packing (left). Bottom row: lateral porosity (left) and velocity distribution calculated with a lattice-Boltzmann method (middle) in a reconstructed microchip packing; time-dependent axial dispersion in the empty and particle-packed reconstructed microchannel, simulated with a random–walk particle-tracking method (right).
Panel B. Comparison of the normalized axial dispersion coefficient Dax/Dm as a function of the reduced velocity in the reconstructed microchip packings with experimental data from HPLC/UV-microchips (uav is the average fluid flow velocity, dp = 5.51 µm is the Sauter mean diameter of the packing material, and Dm = 1.5 x 10⁻⁹ m2/s is the bulk diffusion coefficient of the tracer particles. Experimental data were duplicated with microchips slurry-packed under the indicated conditions, and each value of Dax/Dm is the average of three measurements. Relative standard deviations of simulated and experimental data are between 3 and 5%.